By Yuval Agani (Matityahu Farm) and Yishai Wachsmann (Haifa Groups)
Fruit orchards are crops of high economic importance, and fertilization management has a decisive impact on both yield quantity and quality. Nevertheless, fertilization is often undervalued, leading to either under- or over-application – mainly due to insufficient knowledge of fertigation through drip irrigation systems, the primary irrigation method in Israel.
With climate change and the need to conserve water, understanding optimal fertigation practices has become critical. To monitor nutrient accumulation in trees and soil and draw evidence-based conclusions, multi-year trials are essential.
The trial described here was conducted between 2020 and 2025 and examined the effects of different fertilization regimes on peach tree development, vegetative growth, and yield. The strategies tested included: fertigation with soluble fertilizers, annual application of controlled-release fertilizers (CRF), and a combination of both – compared with the standard commercial fertilization practice.
Materials and Methods
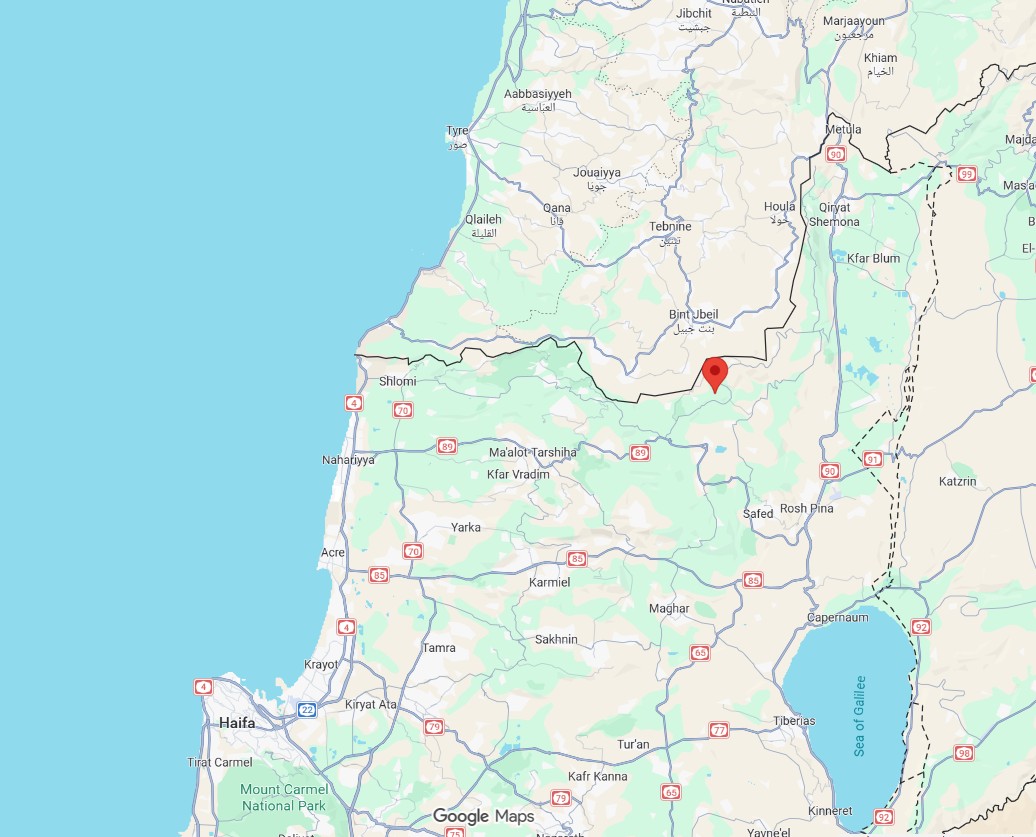 The trial was conducted at Matityahu Farm in the Upper Galilee, in a peach orchard (cv. 1881) planted in 2019 at a spacing of 3 × 4 meters. The plot was divided into four treatments, each with four replicates. Ten trees were sampled in the central row of each replicate.
The four fertilization regimes were:
- Conventional practice – regional fertilization protocol based on extension service recommendations and leaf analysis.
- Soluble fertilizers – application of NPK fertilizers (Poly-Feed™ range) and Haifa straight fertilizers, guided by soil nutrient monitoring.
- Controlled-release fertilizer (CRF) – a single annual application of Multicote™ Agri in the furrow beneath the drip line.
- Combined treatment – CRF as a base, supplemented with soluble fertilizers during the season according to tree status.
Comparison between fertilizers used
| Haifa's solid fertilizers | Liquid fertilizers used in common practice | |
| Fertilizer types | Poly-Feed soluble NPK+ME, based on urea; straight soluble fertilizers | Liquid fertilizers based on ammonium nitrate/urea, phosphoric acid. No ME. |
| Phosphorus in the fertilizer | According to Haifa's nutrition strategy, the fertilization programs always include P. | According to the decision of the extension service rep; in many cases only as phosphoric acid used to clean the drip line. |
| P source | MAP – enables use of chelated ME. | Phosphoric acid – reducing pH to levels that don't allow use of ME chelates. |
| K source | Potassium nitrate | KCl |
| Micronutrients | Included in Poly-Feed formulas and can be mixed with Haifa's straight fertilizers. | Provided according to leaf analysis, in the form of foliar sprays. Iron is sometimes given separately. |
In 2020, treatment 2 (Haifa's soluble fertilizers) provided high phosphorus levels to encourage root development. In 2021 a 1:1 nitrogen-to-potassium ratio was applied to promote growth and fruiting. In 2022 and 2023 a 2:3 nitrogen-to-potassium ratio was employed, where most nitrogen was applied at early stages of the season, and potassium applied later, during fruit development.
It can be seen that there are significant differences between treatments in the fertilizer rates of the various nutrients each season.
In the first year (2020), the conventional treatment included nitrogen only. The CRF and combined treatments contained relatively high nitrogen levels compared to the other nutrients, while the soluble fertilizer treatment provided an approximately balanced 1:1:1 ratio.
In the second year (2021), only nitrogen was applied in the conventional treatment. The soluble fertilizer treatment supplied a 2:1:2 ratio, while the CRF and combined treatments included relatively high potassium levels. Across all treatments in this year, approximately 10 units of nitrogen were applied.
In 2022, all treatments received approximately the same potassium rate (~20 units), while nitrogen ranged between 14 and 20 units. Phosphorus was applied in varying amounts, whereas no phosphorus was applied in the conventional treatment.
In 2023, lower amounts of CRF were applied in both the CRF and combined treatments due to residual fertilizer remaining in the soil from 2022 that had not yet been released, making standard application rates unnecessary.
Nutrients provided by different treatments (kg/ha N-P₂O₅-K₂O)
| Year | Conventional | Soluble | CRF | Combined |
| 2020 | 100-0-0 | 80-100-80 | 60-10-20 | 120-80-70 |
| 2021 | 100-0-0 | 120-60-120 | 100-20-140 | 100-40-150 |
| 2022 | 200-0-200 | 230-80-170 | 140-20-210 | 150-60-220 |
| 2023 | 250-0-300 | 220-90-260 | 80-10-110 | 90-50-120 |
| 2024 | 120-0-160 | 90-60-40 | 140-20-210 | 180-90-200 |
| 2025 | 240-0-280 | 130-70-160 | 150-20-220 | 160-50-230 |
It can be noted that there are significant differences between treatments in the fertilizer rates of the various nutrients each season.
In the first year (2020), the conventional treatment included nitrogen only. The CRF and combined treatments contained relatively high nitrogen levels compared to the other nutrients, while the soluble fertilizer treatment provided a balanced ratio of approximately 1:1:1.
In the second year (2021), only nitrogen was applied in the conventional treatment. The soluble fertilizer treatment supplied a 2:1:2 ratio, while the CRF and combined treatments included relatively high potassium levels. Across all treatments this year, approximately 10 units of nitrogen were applied.
(unit = 10 kg/ha).
In 2022, all treatments received approximately the same potassium rate (~20 units), while nitrogen ranged between 14 and 20 units. Phosphorus was applied in varying amounts, whereas no phosphorus was applied in the conventional treatment.
In 2023, lower amounts of CRF were applied in both the CRF and combined treatments due to residual fertilizer remaining in the soil from 2022 that had not yet been released, making standard application rates unnecessary.
Results (2020–2025)
Yield
Soluble fertilizer treatment achieved the highest yields in the first years, and therefore the highest cumulative yield. It is closely followed by the combined treatment. The conventional treatment was lower, and CRF was the lowest.
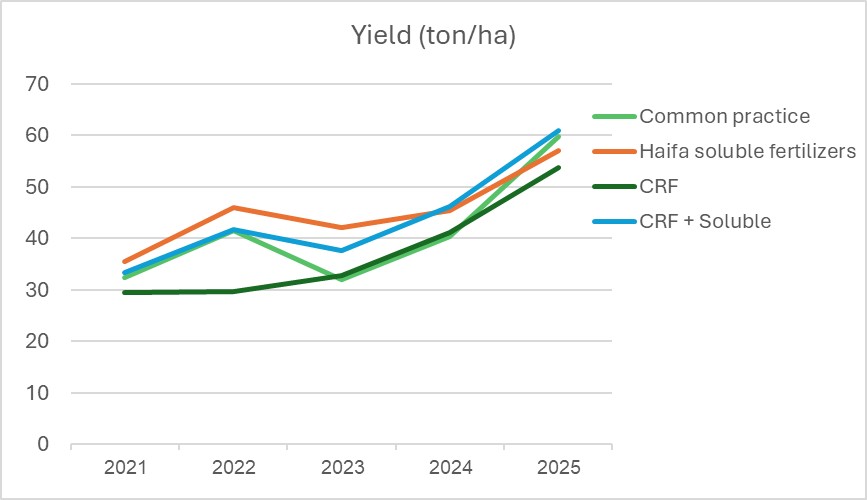
5-year cumulative yield (t/ha equivalent):
| Treatment | Ton/ha |
| Soluble | 225.34 (A) |
| Combined | 221.66 (A) |
| Common practice | 206.45 (AB) |
| CRF | 188.66 (B) |
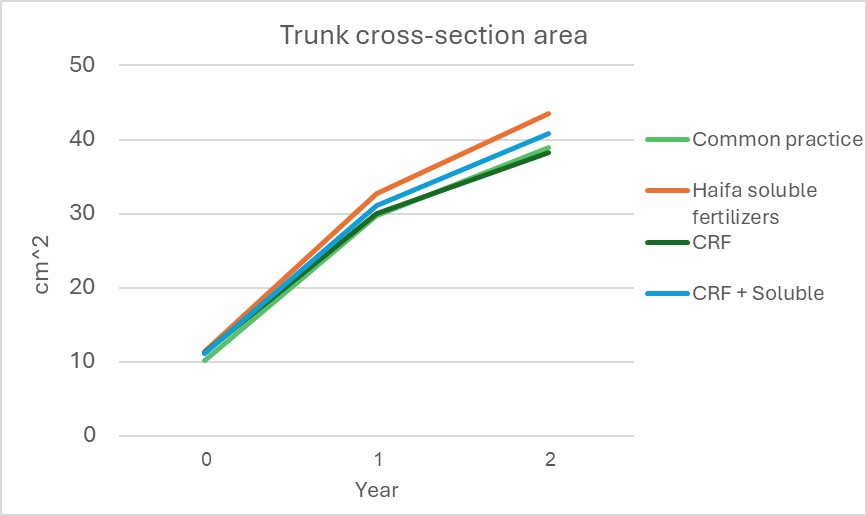
Tree Development
Vegetative growth (measured by trunk cross-sectional area) followed the same ranking as yield:
Soluble > Combined > Conventional > CRF
Leaf Analysis
Results highlighted limitations of leaf analysis as a sole monitoring tool:
- Nitrogen: All treatments within optimal range (2.4–2.8%), no differentiation
- Phosphorus: Above maximum threshold in all treatments – even where no phosphorus was applied
- Potassium: No significant differences; low levels (~1%) observed across the plot in 2023
- Micronutrients: Results did not consistently reflect fertilization practices
Soil Nitrogen and Potassium Analysis as a Tool for Fertilization Control and Guidance:
Soil solution extractors were placed in depths of 30 and 60 cm in the soluble fertilizer treatment, with the aim of adjusting fertilization according to nutrient status in the soil.
Nitrate nitrogen concentrations measured in the soil were relatively high at the beginning of the season (25–50 ppm) and declined significantly as the season progressed.
In the 2022 season, more nitrogen than planned was applied (23 units vs. 17–20 planned), due to low values measured from May through the end of the season. However, fruit grading results showed relatively low color scores in the soluble fertilizer treatment, indicating higher-than-desired nitrogen levels. Therefore, in 2023, nitrogen fertilization remained low and did not exceed 20 units, despite low soil levels.
It is possible that nitrogen uptake is relatively low early in the season (up to May) and increases thereafter. During July–August, an increase in soil nitrate concentration was observed, possibly indicating reduced nitrogen uptake by the trees at this stage.
After harvest, a significant demand for nitrogen was observed, as low concentrations were measured in the soil, and no nitrogen was detected at 60 cm depth – indicating that the missing nitrogen was not leached.
The pattern of potassium concentration in the soil varied between years, suggesting that this tool is not suitable for controlling potassium fertilization.
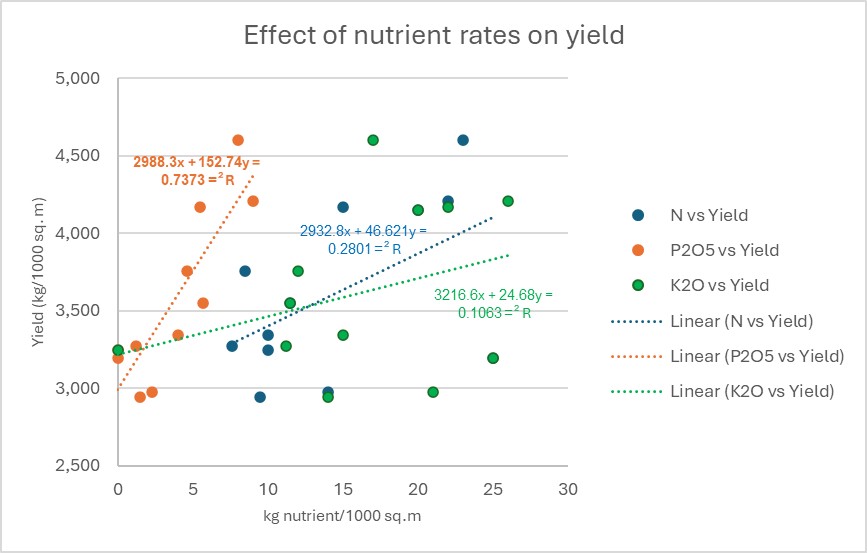
Relationship between nutrient supply and yield
The effect of fertilization rates on yield varied by nutrient:
- Nitrogen: No correlation with yield (R² = 0.11)
- Phosphorus: Strong correlation with yield (R² = 0.73)
- Potassium: Weak linear correlation with yield (R² = 0.28)
Discussion and Conclusions
- Limitations of leaf analysis:
Traditional leaf testing failed to reflect real differences in yield and growth, even under suboptimal fertilization –highlighting the need for real-time monitoring tools. - Vegetative growth drives yield:
Faster early vegetative development supports earlier and higher yield potential. - Fertilization control using soil solution extractors:
This method is known to be unsuitable when using controlled-release fertilizers, and in this trial, it was also found to be less effective for managing potassium fertilization. However, it appears to have value in guiding nitrogen fertilization and in determining the timing for initiating nitrogen applications. Further calibration is required if this method is to be used effectively. - Best-performing strategy:
Soluble fertilizers delivered the highest cumulative yield. The conventional approach performed slightly lower, indicating the need to reassess standard recommendations and reliance on leaf analysis. - Role of phosphorus:
Treatments including phosphorus and micronutrients achieved better results, despite leaf tests not indicating deficiency. Phosphorus showed the strongest correlation with yield. - CRF performance:
Lowest yield, but still a viable option where fertigation is not possible. Results may reflect suboptimal application in certain years. Notably, CRF programs typically reduce fertilizer rates by ~30% compared to conventional fertilization. - Fruit quality:
No significant differences in fruit size or grading were observed between treatments. Some color differences occurred when nitrogen was applied close to harvest but were later corrected. - Fertilization cost:
Costs were similar across treatments, making the performance differences far more significant than cost differences. Labor for CRF application was not included.
Future Research
The study did not provide a definitive solution for optimal fertilization monitoring. Even sap analysis may not fully address this need. Continued multi-year research is planned to validate findings in mature orchards.
Acknowledgments
Thanks to Moti Peres for data analysis, to Haifa Group for funding and partnership, and to Matityahu Farm for enabling this complex trial.
References:
- Israeli Ministry of Agriculture – Stone Fruit Guidelines (Spring 2024)
- Fox et al. (2025) HortTechnology 35(5):810–820
- Mota et al. (2024) Horticulturae 10, 36
- Johnson, R.S. (2008) Nutrient and Water Requirements of Peach Trees