
Leaf analysis standards
Sample: 50 recently-matured leaves with petiols
Timing: initial flowering
Excess | Normal | Deficiency | Nutrient |
>4% | 3-4% | 2.3-2.49% | N |
>0.5% | 0.3-0.5% | 0.2-0.29% | P |
>3.5% | 2.5-3.5% | 1-1.49% | K |
>1.5% | 0.5-1% | 0.6-0.79% | Ca |
>0.4% | 0.3-0.4% | 0.25-0.29% | Mg |
>0.6% | 0.3-0.6% | <0.29% | S |
Excess | Normal | Deficiency | Nutrient |
>50 ppm | 50 ppm | <50 ppm | Fe |
>50 ppm | 50 ppm | <50 ppm | Mn |
>20 ppm | 20 ppm | <20 ppm | Zn |
>7 ppm | 7 ppm | <7 ppm | Cu |
>50 ppm | 30-50 ppm | <50 ppm | B |
K application rates
General guidelines for K application by fertigation
Multi-K Kg/ha | Recommended rate ( K2O kg/ha) | Share of K2O at stage (%) | Stage |
65 | 30 | 15 | Leaf emerence |
87 | 40 | 20 | Flowering |
109 | 50 | 25 | Fruit set |
109 | 50 | 25 | Fruit growth |
65 | 30 | 15 | Fruit maturation |
435 | 200 | 100 |
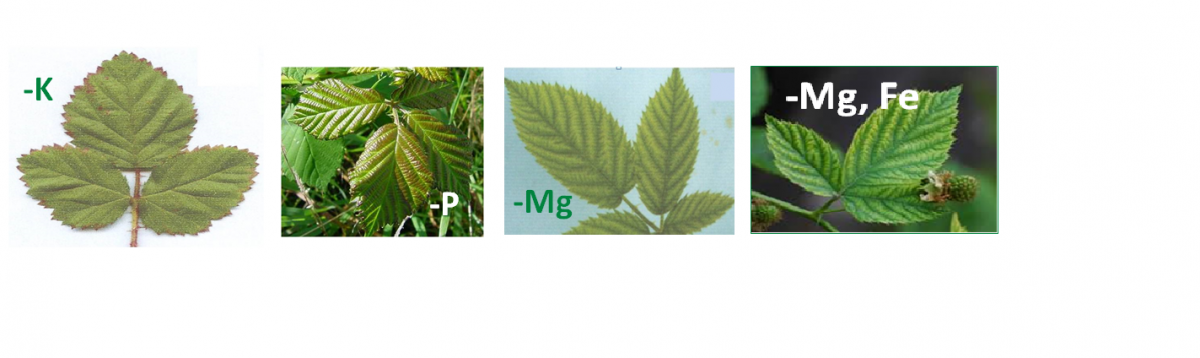
Deficiency symptoms
Nutritional requirements
Estimated yield (ton/ha) | N | P | K | Ca | Mg | S | Fe | Cu | Mn | Zn | B |
kg/ha | g/ha | ||||||||||
5 | 29 | 6 | 34 | 11 | 15 | 12 | 86 | 20 | 191 | 41 | 60 |
10 | 57 | 12 | 68 | 21 | 29 | 24 | 171 | 40 | 382 | 81 | 120 |
15 | 86 | 18 | 102 | 32 | 44 | 35 | 257 | 60 | 573 | 122 | 180 |
20 | 114 | 24 | 136 | 42 | 59 | 47 | 342 | 80 | 764 | 161 | 240 |
N, P and K demand throughout the season, blackberry var. Tupi under intensive production (Oseguera and Sánchez, Mexico, 2015)
Growth stage | Nitrogen | phosphorus | Potassium | |
---------------------- % ----------------------- | ||||
Vegetative - before defoliation | 18 | 12 | 16 | |
After defoliation - sprouting | 23 | 22 | 24 | |
Sprouting - flowring | 4 | 24 | 26 | |
flowring - fructification | 55 | 42 | 34 | |
Total | 100 | 100 | 100 | |