

Contents
For many years, Haifa carried out laboratory and field trials with its products and unique fertilization programs in rice crop. These agronomical activities were performed in several important rice growing countries, as can be seen in the following examples:
5.1.1 Scientific work – Mekong Delta
Research treatments with Haifa Bonus+Mg were carried out in the Mekong Delta to determine the effect of rate and timing of Haifa Bonus+Mg spray.
Table 5.1 describes experiments done with the variety: OM 1706 which has a typical 99 days life span from sawing to harvest.
Table 5.1: Effects of rate and timing of Haifa Bonus+Mg spray on growth and yield, Cuu Long, Mekong Delta, Rice Research Institute, Vietnam - 1997 (Dr. Pham Sy Tan)
| Treatment* | Filled grains/ panicle | Empty grains (%) | Grain yield (t/ha) | Grain yield increase | |
| ( t/ha) | % | ||||
| Control (no spray) | 46 | 15.7 | 4.56 | ||
| Mean for T1-T4 (1%) | 4.81 | ||||
| T1 40 DAS** @ 1% | 47 | 14.5 | 4.73 | 0.17 | 3.7 |
| T2 60 DAS @ 1% | 48 | 16.8 | 4.78 | 0.22 | 4.8 |
| T3 40 & 60 DAS @ 1% | 50 | 14.9 | 4.83 | 0.27 | 5.9 |
| T4 40, 60 & 75 DAS @ 1% | 52 | 17.5 | 4.88 | 0.32 | 7.0 |
| Mean for T5-T8 (2%) | 5.05 | ||||
| T5 40 DAS @ 2% | 49 | 15.9 | 4.85 | 0.29 | 6.4 |
| T6 60 DAS @ 2% | 48 | 13.7 | 4.90 | 0.34 | 7.5 |
| T7 40 & 60 DAS @ 2% | 54 | 15.2 | 5.19 | 0.63 | 13.8 |
| T8 40, 60 & 75 DAS @ 2% | 57 | 14.8 | 5.25 | 0.69 | 15.1 |
| Mean for T9-T12 (3%) | 5.17 | ||||
| T9 40 DAS @ 3% | 49 | 14.2 | 4.98 | 0.42 | 9.2 |
| T10 60 DAS @ 3% | 50 | 13.1 | 5.17 | 0.61 | 13.4 |
| T11 40 & 60 DAS @ 3% | 55 | 16.5 | 5.22 | 0.66 | 14.6 |
| T12 40, 60 & 75 DAS @ 3% | 59 | 12.7 | 5.29 | 0.73 | 16.0 |
| LSD 5% | 4.0 | 0.36 | |||
* Haifa Bonus+Mg spray at concentrations 1%, 2%, 3%, T = treatment ** DAS = days after sowing
Conclusions:
- The higher the Haifa Bonus concentration checked in this experiment, the higher the number of full grains/panicle and grain yield, and the lower the rate of empty grains.
- Generally, one treatment at 60 DAS was better than at 40 DAS regarding the above-mentioned parameters.
- Two treatments at 40 & 60 DAS were always better than one of any one of the two.
- Three sprays at 40 & 60 & 75 DAS were always better than the two at 40 & 60 DAS; hence the treatment of three sprays always produced the highest grain yield.
Table 5.2: The Effect of Foliar Sprays with Haifa Bonus+Mg at 3% on yield and the economical return (Phạm Sỹ Tân, Rice Research Institute, Cantho, Việt nam (1997)
| Treatments | Grain yield (t/ha) | Grain yield increase | Haifa Bonus+Mg cost (US$/ha) | Labor cost (US$/ha) | Net return (US$/ha) | |
| % | (US$/ha) | |||||
| Control, unsprayed | 4.56 | – | – | – | – | – |
| 40 | 4.98 | 9.2 | 49.2 | 8.4 | 6.25 | 34.5 |
| 60 | 5.17 | 13.3 | 71.4 | 8.4 | 6.25 | 56.7 |
| 40 & 60 | 5.22 | 14.4 | 77.3 | 16.8 | 12.5 | 47.9 |
| 40, 60 & 75 | 5.29 | 16.0 | 85.5 | 25.3 | 18.75 | 41.4 |
Conclusions:
- One treatment at 60 DAS was better than at 40 DAS regarding yield parameters.
- Two treatments at 40 & 60 DAS were better than one of any one of the two regarding yield parameters.
- Three sprays at 40 & 60 & 75 DAS were better than the two at 40 & 60 DAS, regarding yield parameters; hence, the treatment of three sprays always produced the highest grain yield. However, under the relative prices of rice labor and fertilizers, one spray at 60 DAS resulted in the highest return on investment.
5.1.2 Demo plots in the Mekong Delta in Vietnam
Approximately 100 field demo plots, in four regions in the Mekong Delta of Vietnam were conducted by the local extension services in growers’ fields, coordinated with the Mekong Research Institute. At the end of each relevant growing season, field days and educational program were carried out and the local rice farmers saw and learned the benefits of spraying Haifa Bonus+Mg (Table 5.3).
Table 5.3: Distribution list of the 100 demo plots in the Mekong Delta, and the contribution of Haifa Bonus+Mg sprays to grain yields in them.
| Region | Number of demo plots | Representative grain yield (t/ha) | Increase | ||
| Haifa Bonus+Mg | Control | (t/ha) | (%) | ||
| An Giang | 30 | Mean: 6.57 Range: 5.06 – 8.02 | Mean: 5.99 Range: 4.48 – 6.83 | 0.58 | 9.7 |
| Kieân Giang | 20 | Mean: 6.70 Range: 6.13 – 7.20 | Mean: 6.21 Range: 5.53 – 6.80 | 0.49 | 7. 9 |
| Caàn Thô | 30 | Mean: 6.83 Range: 5.54 – 8.46 | Mean: 6.39 Range: 4.90 – 8.00 | 0.61 | 6. 9 |
| Soùc Traêng | 20 | Mean: 6.37 Range: 4.90 – 7.33 | Mean: 5.70 Range: 4.20 – 6.36 | 0.64 | 11.8 |
Conclusions:
- All the one hundred demo plots in all parts of the huge area checked, which serves as Vietnam's most important rice producer, yielded positive results to the spraying treatments with Haifa Bonus+Mg.
- The contribution to grain yields was between 0.5 and 0.65 t/ha, representing yield increment of 7-12%.
5.1.3 Scientific experiments in Northern Vietnam (Bac Giang, Nam Dinh)
All following data are based on the scientific work of Tran Thuc Son and Le Xuan Anh, as summed up in the paper: Effect of foliar fertilizers (KNO3, NPK1-ZN, NPK2-MG) for paddy rice on degraded soil of Vietnam.
The comprehensive scientific research was done in Northern Vietnam, in two locations, by spraying three different Haifa BonusTM formulae: Haifa BonusTM+ Zn (12-6-38 +Zn), Haifa Bonus+Mg (12-6-38 +Mg) and Haifa Bonus (13-0-46). These fertilizer solutions were sprayed at a 3% concentration, by either two or three applications (Table 5.4) and the parameters that were carefully checked during the experiments were:
- Number of panicles/m2
- Number of grains/panicle
- 1000 grain weight
- Foliar sprays on rice affected the yield. A significant response was achieved in spring rice also in number of panicles/m2 (Table 5.4).
Table 5.4: Effect of foliar spraying on yield and yield components of rice in Bac Giang, Vietnam (2009)
| Treatment | Number of panicles/m2 | Number of grains/panicle | Weight of 1000 grains (g) | Grain yield (Quintal/ha) |
| Spring crop | ||||
| Un-sprayed | 340 | 90.8 a | 20.0 | 59.0 a |
| Haifa Bonus (2 sprays)* | 343 | 93.7 b | 20.7 | 62.7 b |
| Haifa Bonus+Zn (2 sprays)* | 335 | 95.6 b | 20.8 | 62.8 b |
| Haifa Bonus+Zn (3 sprays)* | 348 | 95.8 b | 20.6 | 64.4 c |
| Haifa Bonus+Mg (2 sprays)* | 344 | 90.6 a | 20.8 | 62.6 b |
| Haifa Bonus+Mg (3 sprays)* | 330 | 101.0 c | 21.0 | 66.1 d |
| LSD 5% | 42.0 | 10.6 | 0.5 | 0.8 |
| Summer crop | ||||
| Un-sprayed | 273 | 121 | 16.6 | 43.2 a |
| Haifa Bonus (2 sprays)* | 313 | 117 | 17.0 | 50.3 b |
| Haifa Bonus+Zn (2 sprays)* | 304 | 116 | 17.1 | 49.2 b |
| Haifa Bonus+Zn (3 sprays)* | 298 | 118 | 17.6 | 50.4 b |
| Haifa Bonus+Mg (2 sprays)* | 310 | 116 | 17.0 | 49.6 b |
| Haifa Bonus+Mg (3 sprays)* | 296 | 121 | 17.0 | 49.6 b |
| LSD 5% | 14.3 | 4.2 | 0.4 | 1.5 |
* Each spray treatment was done at 3% (w/v) solution in 300 L/ha of: Haifa Bonus (13-0-46), Haifa Bonus+Zn (12-6-38 +Zn) or Haifa Bonus+Mg (12-6-38 +Mg).
Conclusions:
- In the spring crop, highest yields of 66.1 and 64.49 quintal/ha were recorded with Haifa Bonus+Mg and Haifa Bonus+Zn, respectively, 3 sprays each. Treatments with 2 sprays only, resulted in lower grain yields of 62.7, 62.8 and 62.6 quintal /ha, respectively. All spray treatments were superior to the unsprayed control. These results were statistically significant.
- The treatment of three sprays of Haifa Bonus+Mg was also significantly best from the point of view of number of grains/panicle and weight of 1,000 grains, but inferior to all other treatments regarding the number of panicles/m2, this shows that this parameter has a relatively minor effect on the yield, when dealing with these high levels of yield.
- In the summer crop, as usual, yields were lower than the spring yields.
- Highest summer grain yield of 50.3 quintal/ha was achieved with 3 sprays of Haifa Bonus+Zn, and lowest yield of 49.2 quintal/ha was achieved with 2 sprays of 3% Haifa Bonus+Zn™. However, all spray treatments results were not statistically different among themselves, but were statistically significantly superior to the unsprayed control (Table5.4).
Table 5.5: Effect of foliar sprayed Haifa Bonus+Zn on rice yield on degraded soil in Bac Giang
| Treatment* | Spring crop | Summer crop | ||||
| Yield | Response | Yield | Response | |||
| Quintal/ha | % | Quintal/ha | % | |||
| Un-sprayed | 53.8 | 39.2 | ||||
| Haifa Bonus (2 sprays) | 57.7 | 3.9 | 7.2 | 46.5 | 7.3 | 18.6 |
| Haifa Bonus+Zn (2 sprays) | 57.5 | 3.7 | 6.9 | 45.3 | 6.1 | 15.6 |
| Haifa Bonus+Zn(3 sprays) | 59.0 | 5.2 | 9.7 | 46.3 | 7.1 | 18.1 |
| Haifa Bonus+Mg (2 sprays) | 57.7 | 3.9 | 7.2 | 46.1 | 6.9 | 17.6 |
| Haifa Bonus+Mg (3 sprays) | 58.9 | 5.1 | 9.5 | 45.7 | 6.5 | 16.6 |
| LSD 5% | 0.8 | 2.7 | ||||
* Each spray treatment was done at 3% (w/v) solution in 300 L/ha of: Haifa Bonus (13-0-46), Haifa Bonus+ Zn (12-6-38 +Zn) or Haifa Bonus+Mg (12-6-38 +Mg).
Conclusions:
- In the spring crop, highest yields of 59.0 and 58.9 quintal/ha were recorded with Haifa Bonus+Zn and Haifa Bonus+Mg, respectively, 3 sprays each. Treatments with 2 sprays only, resulted in lower grain yields. All spray treatments were superior to the unsprayed control.
- In the summer crop, as usual, yields were lower than the spring yields.
- Highest summer grain yield of 46.5 quintal/ha was achieved with 2 sprays of Haifa Bonus.
Table 5.6: Effect of Haifa Bonus on N and K2O uptake by paddy Rice in Bac Giang, Northern Vietnam (2009)
| Treatment* | N response | K2O response | ||
| kg/ha | N % | kg/ha | K2O % | |
| Spring crop | ||||
| Un-sprayed | 83.3 | 108.1 | ||
| Haifa Bonus (2 sprays) | 90.0 | 6.7 | 118.1 | 10.0 |
| Haifa Bonus+Zn (2 sprays) | 92.3 | 9.0 | 123.7 | 15.6 |
| Haifa Bonus+Zn (3 sprays) | 92.8 | 9.5 | 121.9 | 13.8 |
| Haifa Bonus+Mg (2 sprays) | 92.1 | 8.8 | 125.6 | 17.5 |
| Haifa Bonus+Mg (3 sprays) | 96.4 | 13.1 | 127.9 | 19.8 |
| Treatment* | N response | K2O response | ||
| kg/ha | N % | kg/ha | K2O % | |
| Summer crop | ||||
| Un-sprayed | 67.2 | 89.4 | ||
| Haifa Bonus (2 sprays) | 78.6 | 11.4 | 105.7 | 16.3 |
| Haifa Bonus+Zn (2 sprays) | 77.6 | 10.4 | 107.1 | 17.7 |
| Haifa Bonus+Zn (3 sprays) | 81.4 | 14.2 | 110.1 | 20.7 |
| Haifa Bonus+Mg (2 sprays) | 78.8 | 11,6 | 108.5 | 19.1 |
| Haifa Bonus+Mg (3 sprays) | 82.4 | 15.2 | 110.5 | 21.1 |
* Each spray treatment was done at 3% (w/v) solution in 300 L/ha of: Haifa Bonus (13-0-46), Haifa Bonus+Zn (12-6-38 +Zn) or Haifa Bonus+Mg (12-6-38 +Mg).
Conclusions:
- N and K2O uptake by rice plants were higher due to the foliar treatments in both growing seasons.
- The 3-spray treatment with Haifa Bonus+Mg increased N uptake from 83.3 to 96.4 kg/ha in the spring crop, and from 67.2 to 82.4 kg/ha in the summer crop;
- The said treatment also increased K2O uptake from 108.1 to 127.9 kg/ha in the spring crop, and from 89.4 to 110.5 kg/ha in the summer crop.
Experiments were conducted on paddy rice in North Vietnam by spraying Haifa Bonus, to determine the agronomic and economic their efficiency in two common soil types, namely, degraded and alluvial soils. See Tables 5.7-5.10.
Rice cultivar was Khang dan 18.
Table 5.7: Effect of foliar-sprayed Haifa Bonus (13-0-46) on yield and yield-components of rice grown on degraded soil, in Bac Giang, Northern Vietnam (Spring crop - 2009)
| Treatment | Number of panicles/m2 | Number of grain/ panicle | 1000 grain wt. (g) | Grain yield (quintal/ha) |
| Un-sprayed | 331 | 100.8 | 19.9 | 61.3 |
| Haifa Bonus (1 spray: 1st stage)* | 372 | 93.1 | 20.0 | 65.1 |
| Haifa Bonus (1 spray: 2nd stage)* | 375 | 93.5 | 19.7 | 65.2 |
| Haifa Bonus (1 spray: 3rd stage)* | 355 | 99.8 | 19.8 | 65.8 |
| Haifa Bonus (2 sprays: 1st & 2nd stage) | 385 | 97.5 | 19.6 | 66.8 |
| Haifa Bonus (2 sprays: 2nd & 3rd stage) | 359 | 95.5 | 19.8 | 67.0 |
| Haifa Bonus (3 sprays) | 366 | 101.3 | 19.6 | 68.7 |
| LSD 5% | 32.0 | 7.4 | 0.4 | 1.4 |
* 1st stage = Active Tillering (AT); 2nd stage = Panicle Initiation (PI); 3rd stage = Flowering (F)
Table 5.8: Effect of foliar-sprayed Haifa Bonus (13-0-46) on yield and yield-components of rice grown on degraded soil, in Bac Giang, Northern Vietnam (Summer crop - 2009)
| Treatment* | Number of panicles/m2 | Number of grains/panicle | 1000 grain wt. (g) | Grain yield (quintal/ha) |
| Un-sprayed | 324 | 118 | 16.7 | 49.7 |
| Haifa Bonus (1 spray: 1st stage) | 324 | 121 | 17.1 | 52.6 |
| Haifa Bonus (1 spray: 2nd stage) | 328 | 119 | 17.0 | 52.6 |
| Haifa Bonus (1 spray: 3rd stage) | 330 | 119 | 16.9 | 52.1 |
| Haifa Bonus(2 sprays: 1st & 2nd stage) | 330 | 126 | 17.1 | 55.0 |
| Haifa Bonus (2 sprays: 2nd & 3rd stage) | 333 | 123 | 17.0 | 54.7 |
| Haifa Bonus (3 sprays) | 329 | 129 | 17.1 | 56.2 |
| LSD 5% | 7.6 | 4.6 | 0.34 | 0.93 |
* 1st stage = Active Tillering (AT); 2nd stage = Panicle Initiation (PI); 3rd stage = Flowering (F)
Table 5.9: Effect of foliar sprayed Haifa Bonus (13-0-46) on yield and yield-components of rice grown on alluvial soil, in Nam Dinh, Northern Vietnam (Spring crop - 2009)
| Treatment* | Number of panicles/m2 | Number of grains/ panicle | 1000 grain wt. (g) | Grain yield (quintal/ha) |
| Un-sprayed | 238 | 154.8 | 26.1 | 77.9 |
| Haifa Bonus (1 spray: 1st stage) | 233 | 156.0 | 26.7 | 79.7 |
| Haifa Bonus (1 spray: 2nd stage) | 241 | 156.3 | 26.7 | 82.7 |
| Haifa Bonus (1 spray: 3rd stage) | 237 | 149.3 | 27.3 | 79.9 |
| Haifa Bonus (2 sprays: 1st & 2nd stage) | 250 | 152.8 | 26.3 | 83.0 |
| Haifa Bonus (2 sprays: 2nd & 3rd stage) | 254 | 144.7 | 27.3 | 83.1 |
| Haifa Bonus (3 sprays) | 240 | 160.0 | 27.5 | 86.8 |
| LSD 5% | 18.8 | 15.0 | 0.8 | 5.8 |
*1st stage = Active Tillering (AT); 2nd stage = Panicle Initiation (PI); 3rd stage = Flowering (F)
Table 5.10: Effect of foliar sprayed Haifa Bonus (13-0-46) on yield and yield-components of rice grown on alluvial soil, in Nam Dinh, Northern Vietnam (Summer crop - 2009)
| Treatment* | Number of panicles/m2 | Number of grains/ panicle | 1000 grain wt. (g) | Grain yield (quintal/ha) |
| Un-sprayed | 283.3 | 111.5 | 22.1 | 56.3 |
| Haifa Bonus (1 spray: 1st stage) | 261.0 | 128.8 | 22.0 | 60.2 |
| Haifa Bonus (1 spray: 2nd stage) | 266.8 | 128.3 | 21.9 | 61.3 |
| Haifa Bonus (1 spray: 3rd stage) | 292.8 | 114.3 | 22.1 | 60.6 |
| Haifa Bonus (2 sprays: 1st & 2nd stage) | 287.3 | 119.5 | 22.1 | 62.3 |
| Haifa Bonus (2 sprays: 2nd & 3rd stage) | 267.5 | 128.3 | 22.2 | 62.6 |
| Haifa Bonus (3 sprays) | 279.0 | 128.8 | 22.1 | 65.9 |
| LSD 5% | 23.2 | 8.3 | 0.39 | 3.7 |
* 1st stage = Active Tillering (AT); 2nd stage = Panicle Initiation (PI); 3rd stage = Flowering (F)
Conclusions:
- Foliar spray of 3% Haifa Bonus invariably increased the number of panicles/m2, number of grains/panicle and 1000 seed weight. Same results were obtained in the two very different soil types (degraded and alluvial), and in both growing seasons (spring and summer crops).
- Highest yields were always achieved by spraying 3 times 3% Haifa Bonus at 300 L/ha/spray (total 900 liters) during AT, PI and F stages. Haifa Bonus treatments, on degraded soil, in Bac Giang, resulted in: additional 7.4 quintal/ha (12.1%) in spring rice, and additional 6.5 quintal/ha (13.1%) in summer rice, (Table 5.7 - 5.8). And on alluvial soil in Nam Dinh, these sprays resulted in additional 8.9 quintal/ha (11.4%) in spring rice and 9.6 quintal/ha or a record increase of 17.1% (!!) in summer rice (Tables 5.9 – 5.10).
- Somewhat smaller yield response was achieved by applying two sprays of 3% Haifa Bonus (total of 600 L/ha) during AT and PI stages or PI and F stages. The average additional yield achieved on degraded soil was 5.6 quintal/ha (9.1%) in spring rice, and 5.2 quintal/ha (10.4%) in summer rice. The average additional yield achieved on alluvial soil was 8.7 quintal/ha (6.6%) in spring rice and 6.2 quintal/ha (10.9%) in summer rice.
- Lowest yield response of (3.3-6.5%) was achieved by applying only one spray of 3% Haifa Bonus in 300 L/ha during AT or PI or F stages. There was no preferable application timing when comparing these growth stages.
Table 5.11: The efficacy ofHaifa Bonus (13-3-43) foliarfertilizer in direct-sown rice
Treatment | Rate g /20 L | Filled grains (%) | Yield | |
| kg/ha | % over control | |||
| Unsprayed | – | 79.7 | 5,763 | N/A |
| 1 spray @ 40 DAS | 400 (2%) | 81.1 | 6,010 | 4.3 |
| 2 sprays @ 60 & 75 DAS | 600 (3%) | 82.6 | 6,343 | 10.1 |
| 3 sprays @ 40, 60 & 75 DAS | 600(3%) | 86.0 | 6,706 | 16.3 |
| 2 sprays @ 60 & 75 DAS of the local commercial foliar fertilizer 10-52-8 | 400 (2%) | 80.2 | 6,093 | 5.5 |
Conclusions:
- Three foliar sprays of 3% Haifa Bonus (13-3-43) at 40, 60 and 75 DAS (days after sowing), produced the highest percentage of filled grains and highest yield.
5.2.2 Field trial in Nakornpatom by Haifa team
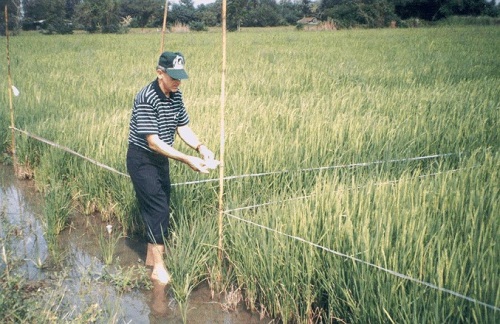
Table 5.12: The effect of three foliar applications with Haifa Bonus (13-3-43) on two cultivars, on yield and net profit
| Treatments* | Yield (t/ha) | Increased output / ha | Haifa Bonus cost (product + application (US$/ha) | Net profit ($ US/ha) | ||
| kg | % | US$/ha*** | ||||
| Cultivar: Photong (100 days) | ||||||
| Unsprayed | 6.63 | – | – | – | – | – |
| 30, 60 & 75 DAS** | 8.35 | 1,720 | 25.9 | 294 | 31.50 | 262.5 |
| Cultivar:Suphan 1(120 days) | ||||||
| Unsprayed | 7.03 | – | – | – | – | – |
| 30, 60 & 75 DAS | 8.20 | 1,170 | 16.6 | 200 | 31.50 | 168.5 |
* Spray volume 375 liter/ha
** DAS = Days after sowing. Product concentrations were 2%, 3% & 3%, respectively.
*** Calculation based on yield value = 171 US$/t of rice grain
Conclusions:
- Three foliar sprays of 2%, 3% and 3% of Haifa Bonus (13-3-43) at 40, 60 and 75 DAS (days after sowing), produced markedly higher yield, and net profit to the grower. The cultivar with shorter growth cycle better profited from these treatments.
5.3 India
Table 5.13: The effect of Haifa Bonus (13-3-43) on rice, 1997
Treatment
| Grain Yield (t/ha) | Increase over control (%) | Additional net income (Rs./ha) |
| Unsprayed | 5.83 a | – | – |
| 3 sprays of Haifa Bonus @ 1%, at 30, 60 & 75 DAS | 6.32 b | 8.4 | 1305 |
| CD (p=0.05) | 0.31 | – | – |
Conclusions:
- Three foliar sprays of 1%, of Haifa Bonus (13-3-43) at 40, 60 and 75 days after sowing, produced markedly higher yield, and net profit to the grower.
5.4 China
Table 5.14: The effect of Haifa Bonus foliar application on rice,AAS, Shanghai, China, (1995)
| Treatment | Yield (kg/ha) | Yield increase / ha | Haifa Bonus (US$/ha)* | Net profit (US$/ha)* | ||
| kg | % | US $* | ||||
| Unsprayed | 12,930 | – | – | – | – | – |
| TwoHaifa Bonus sprays at 3% @ 30 and 60 days after transplanting ** | 14,340 | 1,410 | 11.5 | 215.6 | 21.1 | 194.4 |
* Rice price: 1.3 RMB/kg; Haifa Bonus price: 4 RMB/kg; Exchange rate: 8.5 RMB = 1 US$
** Spray volume: 750 L/ha
Table 5.15: The effect of 2 Haifa Bonus foliar applications on rice at days after transplanting, Guangxi province, S&F Institute, (1994-1995)
| Treatment* | No. of grains/ear | Grains filling rate (%) | Yield (kg/ha) | Increase/ha | Haifa Bonus Cost (US$/ha)** | Net Return (US$/ha)** | |
| kg | % | ||||||
| Unsprayed | 128 | 76.3 | 4,815 | ||||
| Two Haifa Bonus sprays at 2%at30 & 50 DAT*** |
130 |
84.2 |
5,385 |
570 |
11.8 |
14.1 |
73.0 |
| Two Haifa Bonus sprays at 4%at30 & 50 DAT |
132 |
84.4 |
5,557 |
742.5 |
15.4 |
28.2 |
85.3 |
| Two Haifa Bonus sprays at 6%at 30 & 50 DAT |
135 |
86.4 |
5,812 |
997.5 |
20.7 |
42.3 |
110.2 |
* Spray volume: 750 L/ha Pre-plant fertilization: 240 kg/ha of N; 67.5 kg/ha of P2O5; 90 kg/ha of K2O
** Rice price: 1.3 RMB/kg Haifa Bonus price: 4 RMB/kg; Exchange rate: 8.5 RMB = 1 US$
*** DAT= days after transplanting
Conclusions:
- There was a clear-cut advantage to the treatment employing two foliar sprays of 6% Haifa Bonus (13-3-43) at 30 and 40 days after transplanting, over treatments of 2% and 4%. The 6% produced markedly higher (+21%) yield, and a considerable additional net profit to the grower.
5.5 Colombia
Table 5.16: The influence of number and timing of foliar sprays with Haifa Bonus (13-3-43), on yield of upland rice, cultivar:Orizica Yacu 9. (Source: Ricardo Guerrero R., Armando Ortiz Gonzalez - Colombia, 1998)
| Treatments* | Grains filling rate ( % ) | Grain yield | ||
| Haifa Bonus spray* | Crop stage** | kg / ha | Yield increment over control (%) | |
| Unsprayed | 80.3 c | 7300 e | – | |
| 3 Sprays | 1 + 2 + 3 | 82.4 bc | 8300 bc | 14 |
| 2 Sprays | 1 + 2 | 85.0 ab | 8600 b | 18 |
| 2 Sprays | 1 + 3 | 87.7 a | 9200 a | 26 |
| 2 Sprays | 2 + 3 | 83.0 ab | 8000 cd | 9 |
* All treatments received ‘grower’s practice’ of soil applied fertilizers. Spraying rates were always 2% Haifa Bonus @ 350 L/ha.
** Crop stages: 1) Flower initiation; 2) Flowering; 3) Grain formation
Conclusions:
- Although this experiment took place in totally different conditions than the ones previously described for Asia, the results are very consistent.
- Treatments employing two foliar sprays of just 2% Haifa Bonus (13-3-43) at flower initiation and flowering, or grain formation added up to 26% to the grain yield.
- Grain filling rate was again in full accordance with grain yield.
5.6 Korea
An experiment with Controlled Release Fertilizer (CRF) for paddy rice was carried out by the Experiment Institute, Agriculture & Life Science Research Center, Seoul National University, Korea in 2002.
- Cultivar: Chucheongbyeo (ecotype Japonica)
- Commercial recommended nitrogen rate: 150 kg/ha
The composition of the CRF fertilizer checked (Multicote™) was 13-6-7+2MgO+0.2B2O3. Eight of the 13% N were coated urea granules, (CoteN™), while the balance of the 5% were uncoated urea granules. This advanced fertilizer was compared with local farmers' practice of the commercial compound fertilizer: 21-17-17. The application rates of the CRF fertilizer Multicote™, were comparable with the local farmers' practice (100% N recommended, treatment T3), or only 80% of this rate (T2).
Fertilization:
(T1) Control treatment:
- Base dressing (BD): 50% N recommended with 21-17-17, 357 kg/ha
- Topdressing at Tillering stage (TDT): 20% N with Urea at 14 DAT, 65 kg/ha
- Topdressing at Panicle Initiation stage (PI): 30% N with NK fertilizer, at 57 DAT
(T2, T3) Two CRF (Multicote™) base-dressing treatments:
- T2 (80% of recommended N), at 923 kg/ha
- T3 (100% of recommended N) at 1,154 kg/ha
| Treatment | BD Fertilizer N-P2O5-K2O-MgO-B2O3 | Fertilization split N % | ||
| BD | TDT | FPI | ||
| T1, control | 21-17-17 | 50 | 20 | 30 |
| T2, Multicote™ | 13(8)-6-7+2+0.2 | 80 | 0 | 0 |
| T3, Multicote™ | 13(8)-6-7+2+0.2 | 100 | 0 | 0 |
Table 5.17: Yield components, yield and protein content
| Treatment | Panicles (no./m2) | Spikelets (no./panicle) | 1000 grain weight (g) | RGR (%) | Yield (kg/10a) | Protein (%) |
| T1 | 355 | 88 | 23.7 | 70 | 535 | 7.3 |
| T2 | 376 | 89 | 23.6 | 73 | 582 | 7.3 |
| T3 | 384 | 99 | 23.2 | 70 | 612 | 8.0 |
| LSD 5% | 21 | ns | ns | ns | 43 | 0.6 |
Conclusions:
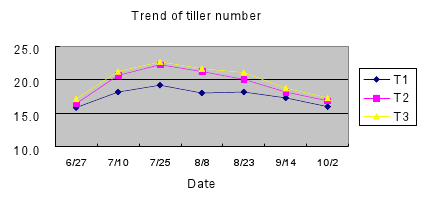
- Comparing with the local commercial treatment control (T1), CRF treatments (T2 & T3) have shown earlier tillering, higher tiller number and higher panicle number at harvest.
- T2 and T3 were significantly higher than T1 regarding dry weight and N absorption rate. T3 had highest N content in the plant but there was no significant difference between T1 and T2.
- Yield was significantly higher in the CRF treatments (T2, T3) than in the control (T1), probably because CRF treatments bore more panicle and spikelets. There was no significant yield difference between the CRF treatments but protein content of milled rice was significantly higher in T3 than T2.
- As CRF fertilization has longer nutrient-effective period than the conventional fertilization, just one base dressing of the CRF, produced better nitrogen nutrition over the entire growth period. One CRF fertilizer application has proven advantageous in tiller number, panicle number and yield over the conventional fertilization, even though it has been split to three applications along the growth season. By applying 100% of recommended N fertilization in the form of CRF (T3), the grain protein content was too high which causes a reduced cooked taste quality.
- Therefore, the CRF treatment applying 80% of recommended N (T2 in the experiment) is the optimal fertilization recommendation bringing about higher yield but equal protein content level as conventional treatment.
5.7 Spain
Experiment series with Controlled Release Fertilizer (CRF) for rice were carried out in the rice department of the (Valencia Institute for Agricultural Research), Sueca - Valencia, Spain, in 2002-2003, (Carreres, Pomares, and Ballesteros).
Cultivars: Ullal, (semi-dwarf, medium grain) in 2002 and Senia (intermediate stature, medium grain) in 2003.
The CRF fertilizer checked was CoteN™, coated urea granules (40% N), and it was compared with five other N sources that were all applied at 130 kg/ha of N, including:
- Urea prills
- Urea combined with dimethyl pyrazole phosphate (DMPP) at three different contents rates (w/w), namely 0.5, 0.75 or 1% of the urea content.
Table 5.18 shows only the parameters in which the differences between the treatments were most obvious.
Table 5.18: Effect of nitrogen fertilizer source on agronomic performance, grain yield and N responses of rice plants
N source | Plant height (cm) | Lodging (%) | Grain yield (t/ha) | No. panicles/m2 | N uptake (kg/ha) | N recovery efficiency (%) |
| No N | 74.0 | 0.5 | 3.61 | 274 | 44.6 | – |
| Urea | 95.7 | 23.0 | 6.73 | 385 | 82.7 | 29.3 |
| CoteN™ | 98.2 | 72.2 | 8.00 | 453 | 105.2 | 46.6 |
| Urea+ DMPP 1% | 96.2 | 34.8 | 7.08 | 388 | 78.4 | 26.0 |
| Urea+ DMPP 0.75% | 96.2 | 26.0 | 7.14 | 399 | 87.1 | 32.6 |
| Urea+ DMPP 0.5% | 95.7 | 21.2 | 7.24 | 403 | 86.3 | 32.1 |
| LSD 5% | 3.6 | 15.7 | 0.66 | 46 | 9.4 | 7.0 |
Conclusions:
- The results showed that CoteN™ applied before flooding was the best N source for grain yield and N recovery efficiency. Its intense effect was shown also by the high lodging rate of the intermediate stature cultivar only.
- Urea combined with DMPP was better than conventional urea
- N recovery efficiencies as high as 80%!!! were obtained at another series of experiments carried out by this research group, when several coating rates and pre-flood N application rates were checked.